Published June 2024.
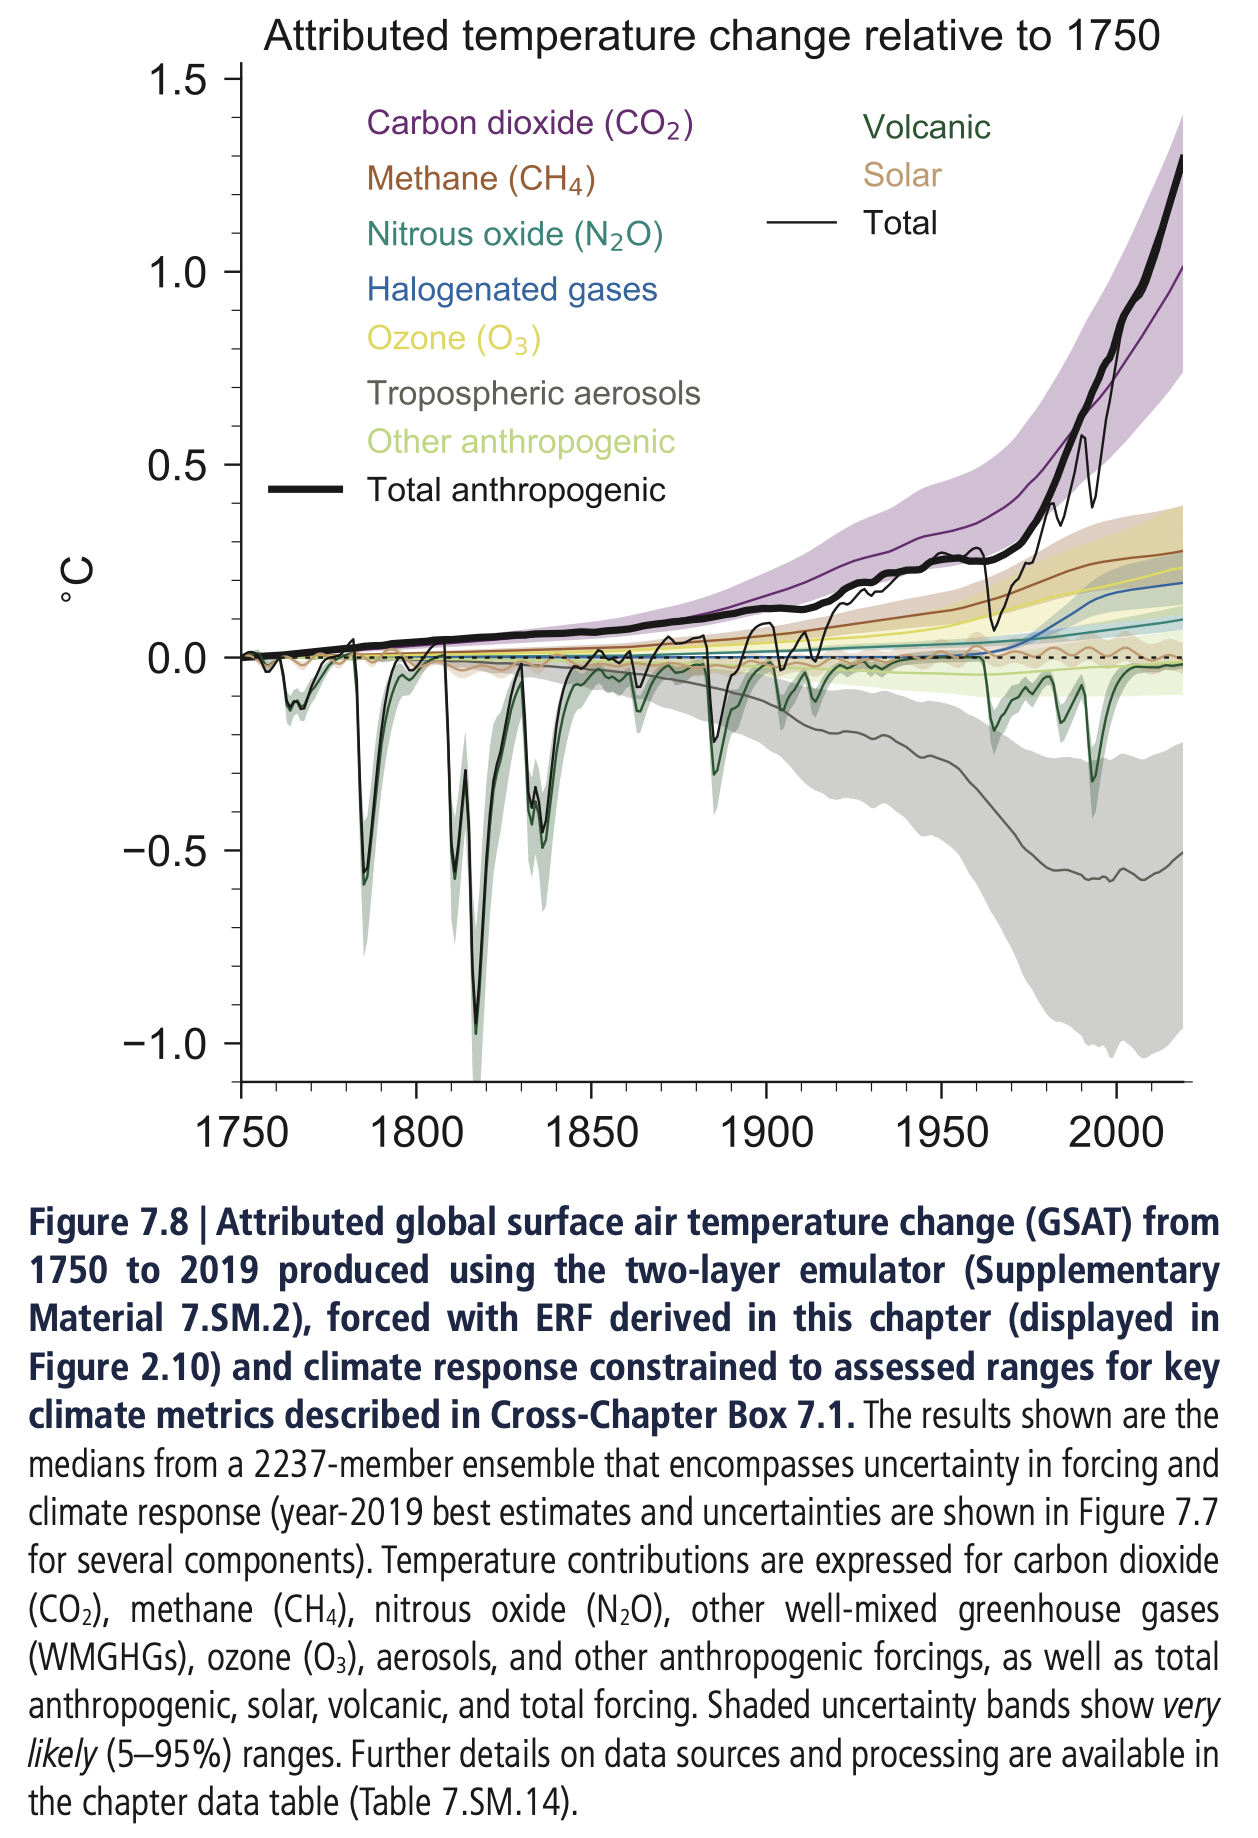
The warming caused by atmospheric constituents is shown below, indicating that carbon dioxide (CO2) is the largest and most rapidly changing contributor.

The last time atmospheric carbon dioxide consistently reached today’s human-driven levels was 14 million years ago.
State of the Planet, Columbia Climate School4
Atmospheric CO2 is a long-lived greenhouse gas (GHG). Earth’s long term warming commitment is therefore almost solely determined by cumulative CO2 emissions (while N2O is also long-lived, it’s contribution is much smaller).
On a century–long timescale:
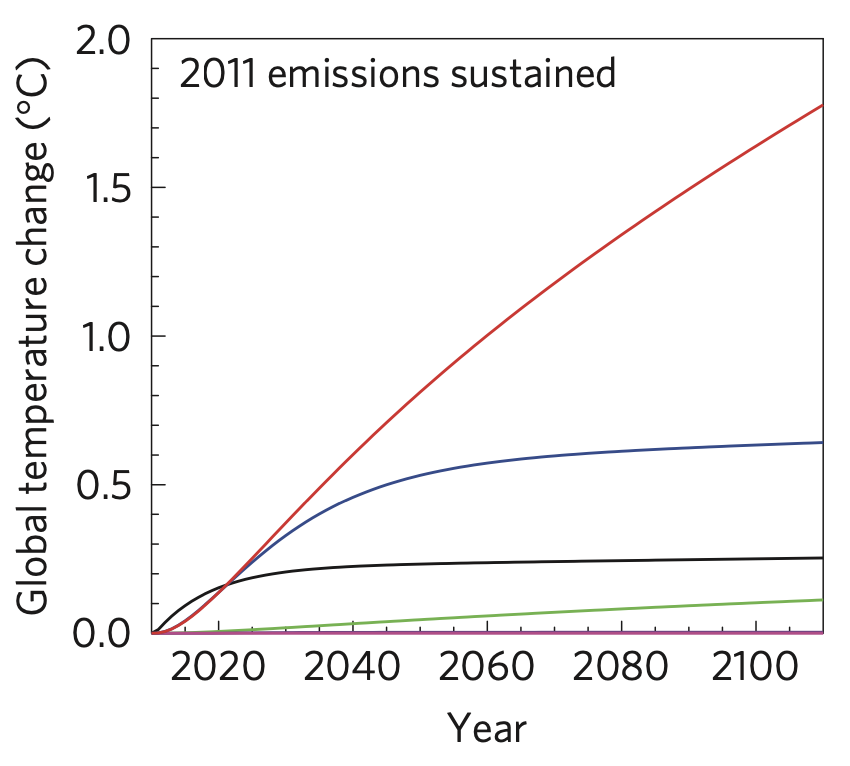
- a pulse emission of CO2 causes a stabilised value of warming;
- sustained emissions of CO2 causes ever increasing warming;
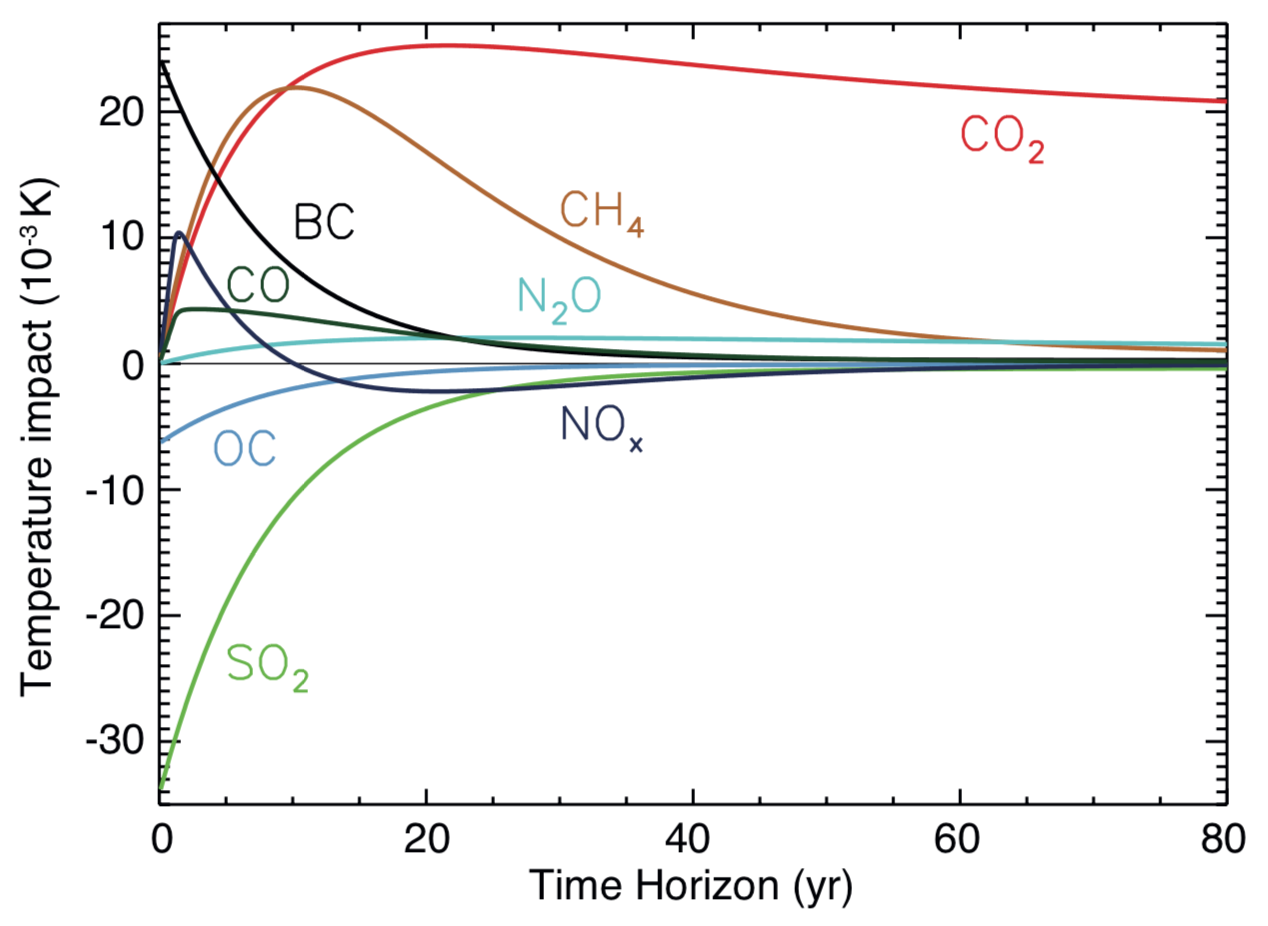
- a pulse emission of a short-lived GHG (e.g. methane, CH4) causes a pulse of warming; and
- a sustained emission of a short-lived GHG causes a stabilised value of warming.
Therefore, in theory, elimination of short-lived GHG emissions (without any change to long-lived) would lower the rate of warming.
Elimination of long-lived GHG emissions (without any change to short-lived) would cause warming to stabilise, and to lower warming, CO2 and N2O would need to removed from the atmosphere.
The warming impact of the cumulative pollutants, CO2 and nitrous oxide, increases steadily as long as these emissions persist, whereas sustained emissions of methane and organic and black carbon aerosols cause temperatures to warm rapidly at first, and then stabilize. A permanent reduction of 50–75% in these SLCPs (short lived climate pollutants) could reduce global temperatures by over 0.5˚C by mid-century, comparable to the impact on these timescales of similar-magnitude reductions of CO2 emissions and, it has been argued, at much lower cost. Stabilizing global temperatures, however, requires net emissions of cumulative pollutants, predominantly CO2, to be reduced to zero.
Allen, M., Fuglestvedt, J., Shine, K. et al. New use of global warming potentials to compare cumulative and short-lived climate pollutants.7.
After 500 years, about a third of a CO2 emission pulse remains in the atmosphere8.
In 2022, 85% of CO2 emissions were due to combustion of fossil fuels –

CO2 emissions from fossil fuels and cement rebounded strongly in 2021, and reached a record 37.2 billion tonnes in 2022 –


Separate fossil fuel emission trends from 1850 to 2022 –

Current emission trends are so rapid that, if maintained, the quantity of CO2 to be emitted between 2010 and 2030 will be equivalent to that emitted between 1750 and 1970 –
It has taken society nearly 220 years (from 1750 to 1970) to emit the first trillion tons of CO2 and only another 40 years (1970–2010) to emit the next trillion tons. The third trillion tons, under current emission trends, would be emitted by 2030 and the fourth trillion tons before 2050.
Xu, Yangyang, and Veerabhadran Ramanathan, “Well below 2 C: Mitigation strategies for avoiding dangerous to catastrophic climate changes”11.
We conclude that, given currently available records, the present anthropogenic carbon release rate is unprecedented during the past 66 million years.
Zeebe, Ridgwell and Zachos, 2016, Anthropogenic carbon release rate unprecedented during the past 66 million years.12
Summary
Sustained emissions of short lived climate pollutants (mainly CH4) cause global warming to increase rapidly at first, and then stabilise. A permanent 50–75% reduction could reduce warming by over 0.5˚C by 2050.
Sustained emissions of long lived climate pollutants (mainly CO2) cause global warming to steadily increase as long as these emissions persist.
Our CO2 emissions:
- have increased the atmospheric concentration of CO2 to a level unprecedented in 14 million years;
- continue to grow with no peak in sight, at a rate unprecedented in the past 66 million years;
- are the largest and most rapidly increasing contributor;
- almost solely determine Earth’s long term warming commitment;
- must be reduced to net-zero to stabilise warming;
- must be removed from the atmosphere to lower warming; and
- almost all (85% in 2022) originated from the world energy system.
- p. 962, Forster, P., T. Storelvmo, K. Armour, W. Collins, J.-L. Dufresne, D. Frame, D.J. Lunt, T. Mauritsen, M.D. Palmer, M. Watanabe, M. Wild, and H. Zhang, 2021: The Earth’s Energy Budget, Climate Feedbacks, and Climate Sensitivity. In Climate Change 2021: The Physical Science Basis. Contribution of Working Group I to the Sixth Assessment Report of the Intergovernmental Panel on Climate Change [Masson-Delmotte, V., P. Zhai, A. Pirani, S.L. Connors, C. Péan, S. Berger, N. Caud, Y. Chen, L. Goldfarb, M.I. Gomis, M. Huang, K. Leitzell, E. Lonnoy, J.B.R. Matthews, T.K. Maycock, T. Waterfield, O. Yelekçi, R. Yu, and B. Zhou (eds.)]. Cambridge University Press, Cambridge, United Kingdom and New York, NY, USA, pp. 923–1054, doi:10.1017/9781009157896.009.[↩]
- Lan, X., Tans, P. and K.W. Thoning: Trends in globally-averaged CO2 determined from NOAA Global Monitoring Laboratory measurements. Version 2024-05 https://doi.org/10.15138/9N0H-ZH07, obtained from https://gml.noaa.gov/ccgg/trends/gl_data.html[↩]
- By [email protected] using Python, https://github.com/shanewhi/world-energy-data[↩]
- https://news.climate.columbia.edu/2023/12/07/a-new-66-million-year-history-of-carbon-dioxide-offers-little-comfort-for-today/[↩]
- Figure 8.33, page 719, IPCC, 2013: Climate Change 2013: The Physical Science Basis. Contribution of Working Group I to the Fifth Assessment Report of the Intergovernmental Panel on Climate Change [Stocker, T.F., D. Qin, G.-K. Plattner, M. Tignor, S.K. Allen, J. Boschung, A. Nauels, Y. Xia, V. Bex and P.M. Midgley (eds.)]. Cambridge University Press, Cambridge, United Kingdom and New York, NY, USA, 1535 pp. https://www.ipcc.ch/report/ar5/wg1/.[↩]
- Allen, M., Fuglestvedt, J., Shine, K. et al. New use of global warming potentials to compare cumulative and short-lived climate pollutants. Nature Climate Change 6, 773–776 (2016), https://www.nature.com/articles/nclimate2998, http://sequoiaforestkeeper.org/pdfs/attachments/Allen_et_al_on_SLCP_GWP_2016.pdf[↩]
- Allen, M., Fuglestvedt, J., Shine, K. et al. New use of global warming potentials to compare cumulative and short-lived climate pollutants. Nature Clim Change 6, 773–776 (2016), https://www.nature.com/articles/nclimate2998, http://sequoiaforestkeeper.org/pdfs/attachments/Allen_et_al_on_SLCP_GWP_2016.pdf[↩]
- Fig. 1 of Aamaas, B., Peters, G. P., and Fuglestvedt, J. S.: Simple emission metrics for climate impacts, Earth Syst. Dynam., 4, 145-170, 2013. https://doi.org/10.5194/esd-4-145-2013.[↩]
- Global Carbon Project, Friedlingstein et al (2023), https://globalcarbonbudgetdata.org/latest-data.html[↩][↩][↩][↩]
- By [email protected] using Python, https://github.com/shanewhi/world-energy-data[↩][↩][↩][↩]
- Xu, Yangyang, and Veerabhadran Ramanathan. “Well below 2 C: Mitigation strategies for avoiding dangerous to catastrophic climate changes.” Proceedings of the National Academy of Sciences 114, no. 39 (2017): 10315-10323. https://www.pnas.org/content/pnas/114/39/10315.full.pdf[↩]
- Zeebe, Richard E., Andy Ridgwell, and James C. Zachos. “Anthropogenic carbon release rate unprecedented during the past 66 million years.” Nature Geoscience 9, no. 4 (2016): 325. https://www.nature.com/articles/ngeo2681[↩]